Teaching LLMs to Math

We’ve all seen the sensational posts of LLMs being unable to count apples at grade level, so let’s first understand why they’re surprisingly bad at certain math — and why they might be surprisingly good at others — before we look at how to get LLMs to do the type of math that’s useful for analytics.
LLMs are bad at math.
Viral examples of LLMs being bad at math usually boil down to arithmetic or textual distractions. The latter being less interesting with questions like which is bigger, 9.11 or 9.9? Coming from software releases, 9.11, actually stands out as the right answer with 9 being the major and 11 being the minor release. Understandably, an LLM could make similar assumptions, especially being biased towards language instead of numerical representations.
More interestingly is why an LLM would be bad at arithmetic we’ve usually mastered in elementary school when it can reason at much higher levels for other tasks? Andrej Karpathy has a great video explaining the intuition behind this.
At the core of it is understanding LLMs are “token simulators” and at each step, it spends a fixed amount of compute to predict the next token — executing the same stack of transformer layers for each. While a traditional algorithm would spend 10-20x more compute on “2^13” vs “2+2”, an LLM would spend only 2x more as “2^13=8192” usually breaks down to 2 tokens, “819” and “2” (using the llama3 vocabulary), vs the single token “4”.
Seeing that it would arrive at the answer by predicting the string “819” and “2” also illustrates that it’s operating on language instead of numbers and symbolic reasoning. Instead of going right to left to systematically multiple 4096 by 2 (or 32 by 256 if using exponentiation by squaring), an LLM is actually building the answer left to right by predicting sometimes multiple of numbers per step due to how vocabularies are trained. The LLM is relying on statistical patterns learned from text to predict tokens instead of actual calculations.
Although very good at predicting next tokens, LLMs aren’t really designed to do arithmetic and are limited by fixed compute per token when simulating arbitrarily precision as numbers get big.
LLMs are good at math?
Treating an LLM like a calculator is a bad idea, but what type of math is it good at?
LLMs are great at summarization, extracting and copying information from a source to a target form. This allows LLMs to cheat by taking a source question and “summarizing” it into code that can do math precisely.

Also, as we’ve seen in many new models, giving an LLM tokens to “think” before answering usually produces betters answers. This gives an LLM more compute to find a solution as it updates its latent space or “working memory” token by token to reason through a problem.
This is similar to the process of writing a mathematical proof where an explanation is required to justify the answer, the proof being the “thinking” tokens. International Mathematics Olympiad questions are such reasoning problems and o1 has claimed an 83% score on it. Although, recently Proof or Bluff has raised some doubt on this claim with “only GEMINI-2.5-PRO [achieving] a non-trivial score of 25%, while all other models achieve less than 5%”, including o1-pro.
While “math” might not be solved, this method of spreading compute has been shown effective for arithmetic on large numbers and is a great step forward.
LLMs for Analytics
The best analysts use tools like Tableau and HyperArc to find actionable correlations and trends in their data through the help of iterative visualizations. Although the end goal is to craft a visualization to make an insight obvious to everyone, an analyst first needs to find it for themselves to know what to highlight.
To empower everyone to have a team of the best analysts, we need LLMs to do what the organic brains of the best analysts do, statistics (or approximations of it). However, statistics falls into the bucket of math LLMs are bad at. But just like an analyst is aided by visualizations, we can aid LLMs with our understanding of what it’s good at to make it a great analyst — and perhaps one that isn’t vulnerable to the shortcomings of approximation.
The Test
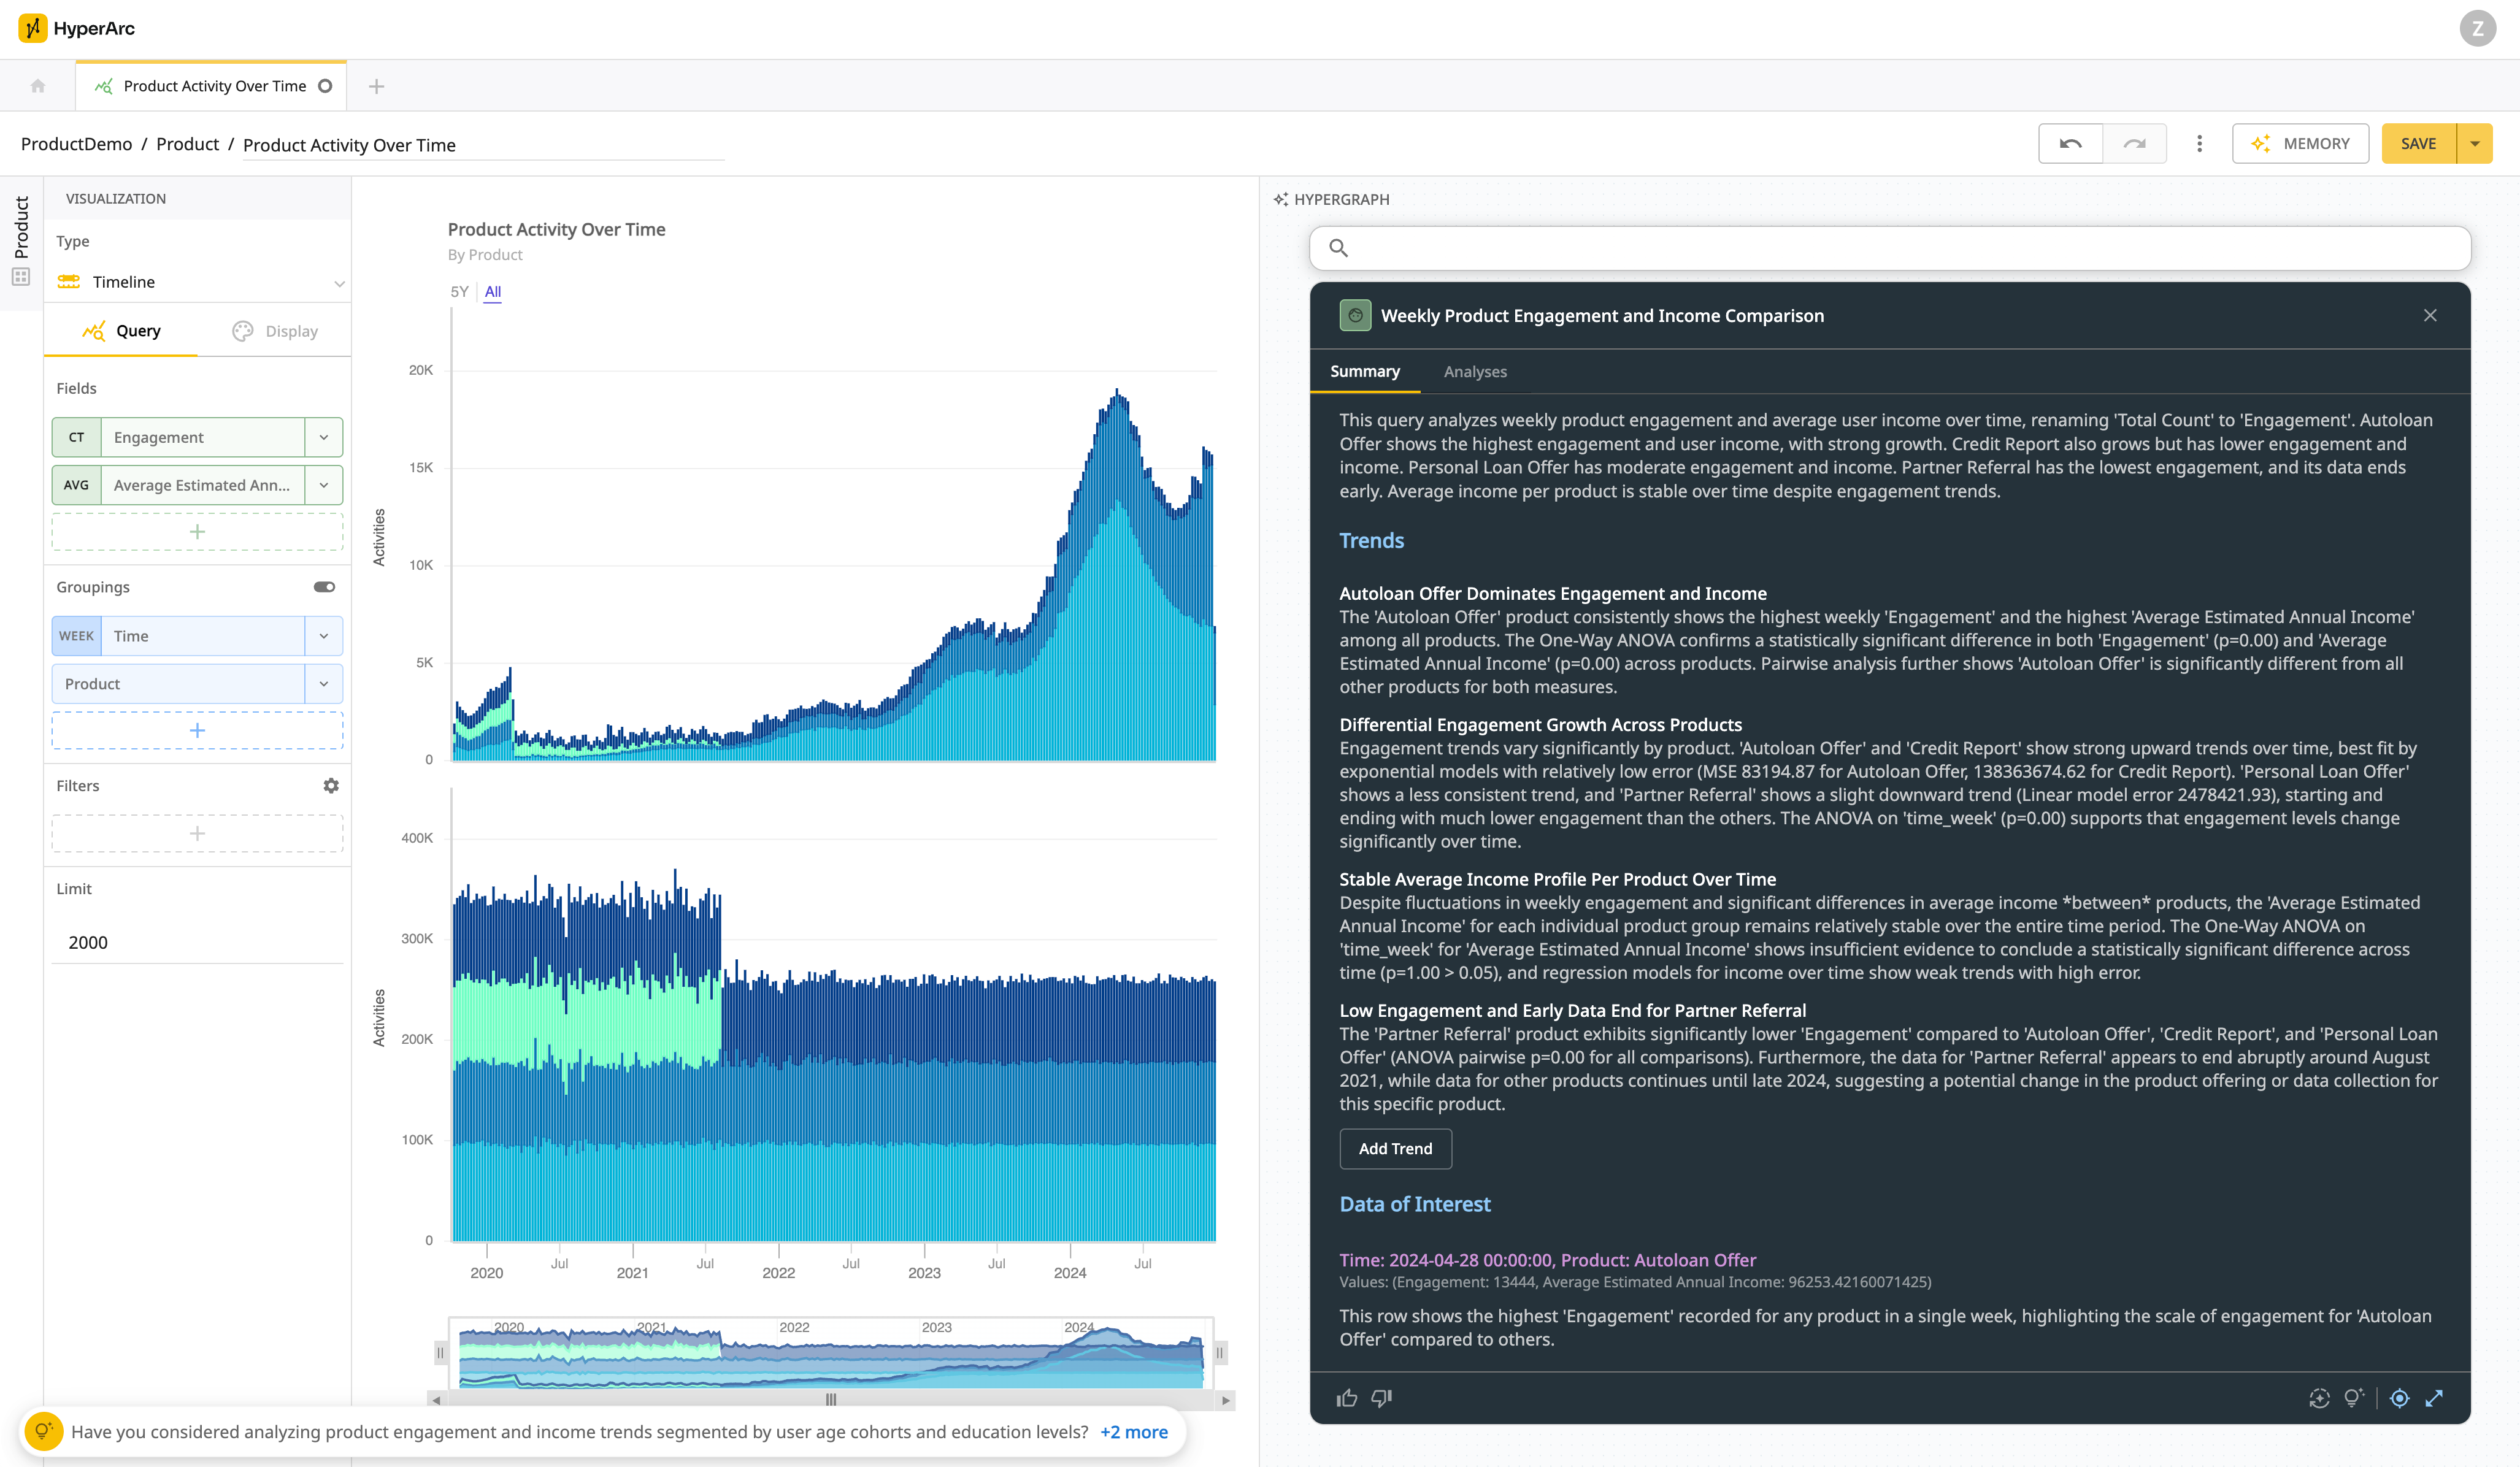
Lets see what an LLM can tell us about this query on synthetic data showing engagement and estimated annual income of users across 4 products over time.
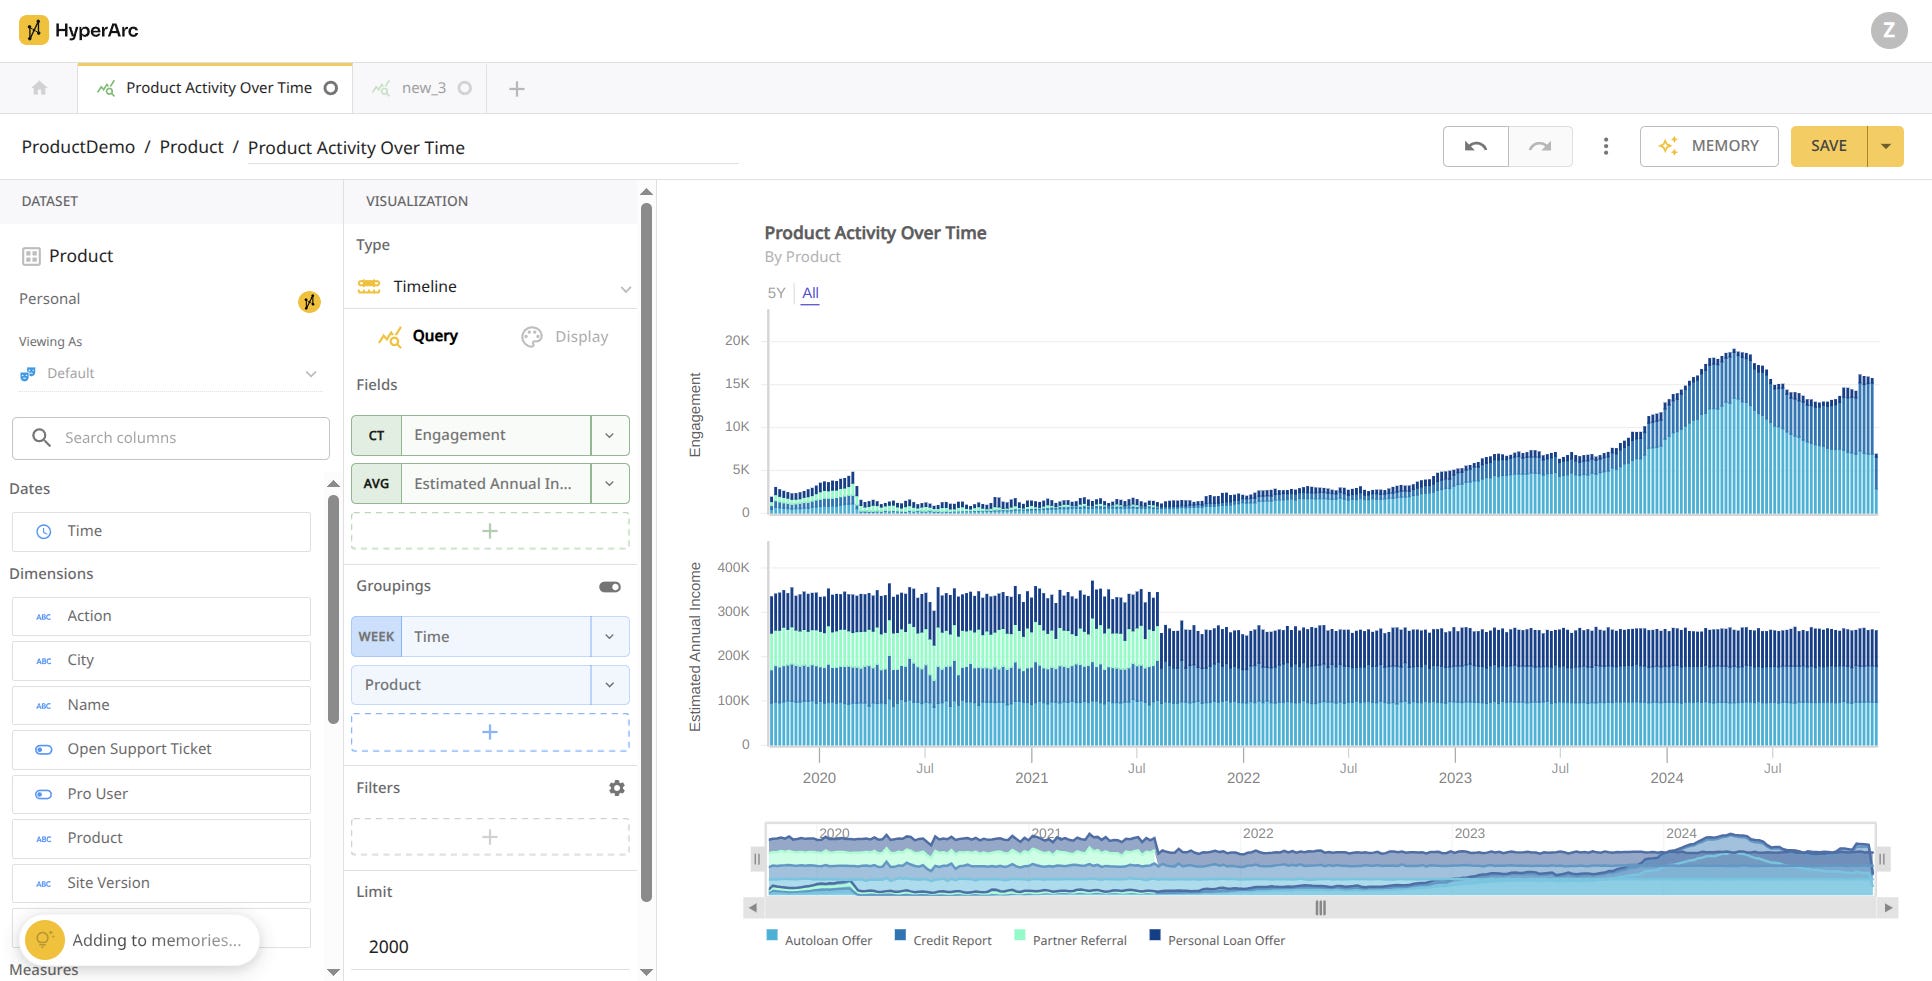
It’s only 900 rows of aggregate data, so not a lot, but non-trivial at 36,000 tokens. The numbers aren’t at risk of overflow, but do have high “arbitrary” precision such as “79121.69312169316”. The trends are a bit tricky in that they show different seasonality at different scales that might obscure each other visually. We can start to see this once the data is unstacked.

The files used so you can try it in your favorite LLM are here.
Baseline
What happens if we just feed the data into 4o?

It’ll usually start with some tool use to do some analysis of the data in python, however it’s all pretty surface level and doesn’t change the final results so we haven’t explicitly told it not to.
The results below sound reasonable, but it did fall for a couple of the traps we set. It was good at “copy and pasting” — in Karpathy’s words — from the source data, accurately finding and comparing many of the min and max values for each product.
However, many of the “trends” it noticed are hallucinations.
Partner Referral’s is not growing, the product actually ended in August 2021.
Personal Loan Offers is also not growing, but declining slowly. It’s the lowest income segment on par with Credit Report.
While the cumulative trend of all products is increasing, the 2 products mentioned above are not, with one having no recent activity.

When just given data, an LLM is great at finding and citing specific data points and prefers to do so as all interesting rows were just min/max values. It does describe some trends, but most of these are just guesses that are at best dubious.
More Compute
What if we gave it more compute by letting it think through the query results first?

It does start to do more interesting things that go beyond just min/maxes such as suggesting “reach expansion, not necessarily market shift” as engagement grows, but income remains stable.
However, most are still guesstimates and generalities such as high volatility in Credit Report, likely from a standard deviation calculated through tool use which incorrectly didn’t account for growth or normalization across products.

More compute helps LLMs go beyond “copy and paste”, however, it still can’t do the math required for statistics needed for analytics.
Cheating
Although an LLM can’t do arithmetic it’s really good at summarization and reasoning so what if we just cheated and give it all the computed statistics it would ever need.
This is what HyperArc does with every query. We use our understanding of the current query to figure out which relevant statistical kernels to run (vs arbitrary code), providing the final statistics for memory synthesis specific to analytics.
Lets see what changes if we include this statistical analysis with the results.

All of the errors of the past 2 attempts are corrected and the LLM is able to confidently cite the statistical facts that back much more sophisticated trends around seasonality and statistically significant interactions between multiple fields.

Providing more statistics than needed for general trends also enables specific follow up questions, citing statistics that weren’t used in the general trends.

To get the most out of LLMs for analytics, we need to use it for what it excels at, reasoning and summarization when given all of the facts, not for the arithmetic traditional systems are great at. HyperArc does this with every query to help you be the best augmented analyst.