A metrics layer is like your New Year's resolution…
It's a great idea, you should probably do it. But like your New Year's resolution, it’s two weeks into January and you've probably already started taking out some of that ice from your daily cold plunge, those intermittent fasts are becoming a little more intermittent, and you’ve been staring into the sun a little less every morning while listening to Huberman.
Unlike your New Year’s resolution you can automate your metrics layer with HyperArc.
Why a metrics layer?
The need for a metrics layer followed the success of democratizing analytics. As more and more of your company became empowered through their own analysis, the question became which analysis is the right analysis? Is usage measured as daily or monthly active users, or a 30 day rolling window? Was it unique users or unique sessions? A metrics layer helped new users get started faster — abstracting out the complexity of calculating a 30 day rolling window of sessions — while standardizing what “usage” meant across all of your dashboards.
However, a metrics layer — like it’s analogous data catalog below it — takes continuous and manual curation and is often a victim of its own success. As metrics and their versions accumulate, the metrics layer starts to need its own metrics layer.
The Achilles heel of the metrics layer is what makes it work today, manual curation by the data and business experts on your team, extra work they shouldn’t need to do (especially with all this AI we’ve been hearing about).
Lost intuition in traditional BI.
We can’t automate the metrics layer in traditional BI as intuition and knowledge is lost just through its use. The hours or days of data exploration to discover all the data issues and insights leading to the perfect metric is truncated and all that is ultimately saved is the final visualization with a scant label.
What every BI tool and metrics layer persists is the tip of the iceberg. Underneath is the lost knowledge of BI — all of the intermediate queries, dead ends, and anomalies that led to those actionable and business changing metrics.
It’s not enough to just have the intermediate queries, that’s just the what. We need the why, the language that is the intuition of your data analysts and tribal knowledge of your business leaders. We need the entire iceberg to sink your metrics layer woes once and for all.
Never forget an insight with HyperArc.
We automatically capture and catalog a team’s knowledge and intuition about their business and data in our HyperGraph as they explore, not leaving homework for after. We monitor every interaction, semantically grouping those that are relevant and branching based on how queries have changed — preserving the meandering mind that makes humans humans.
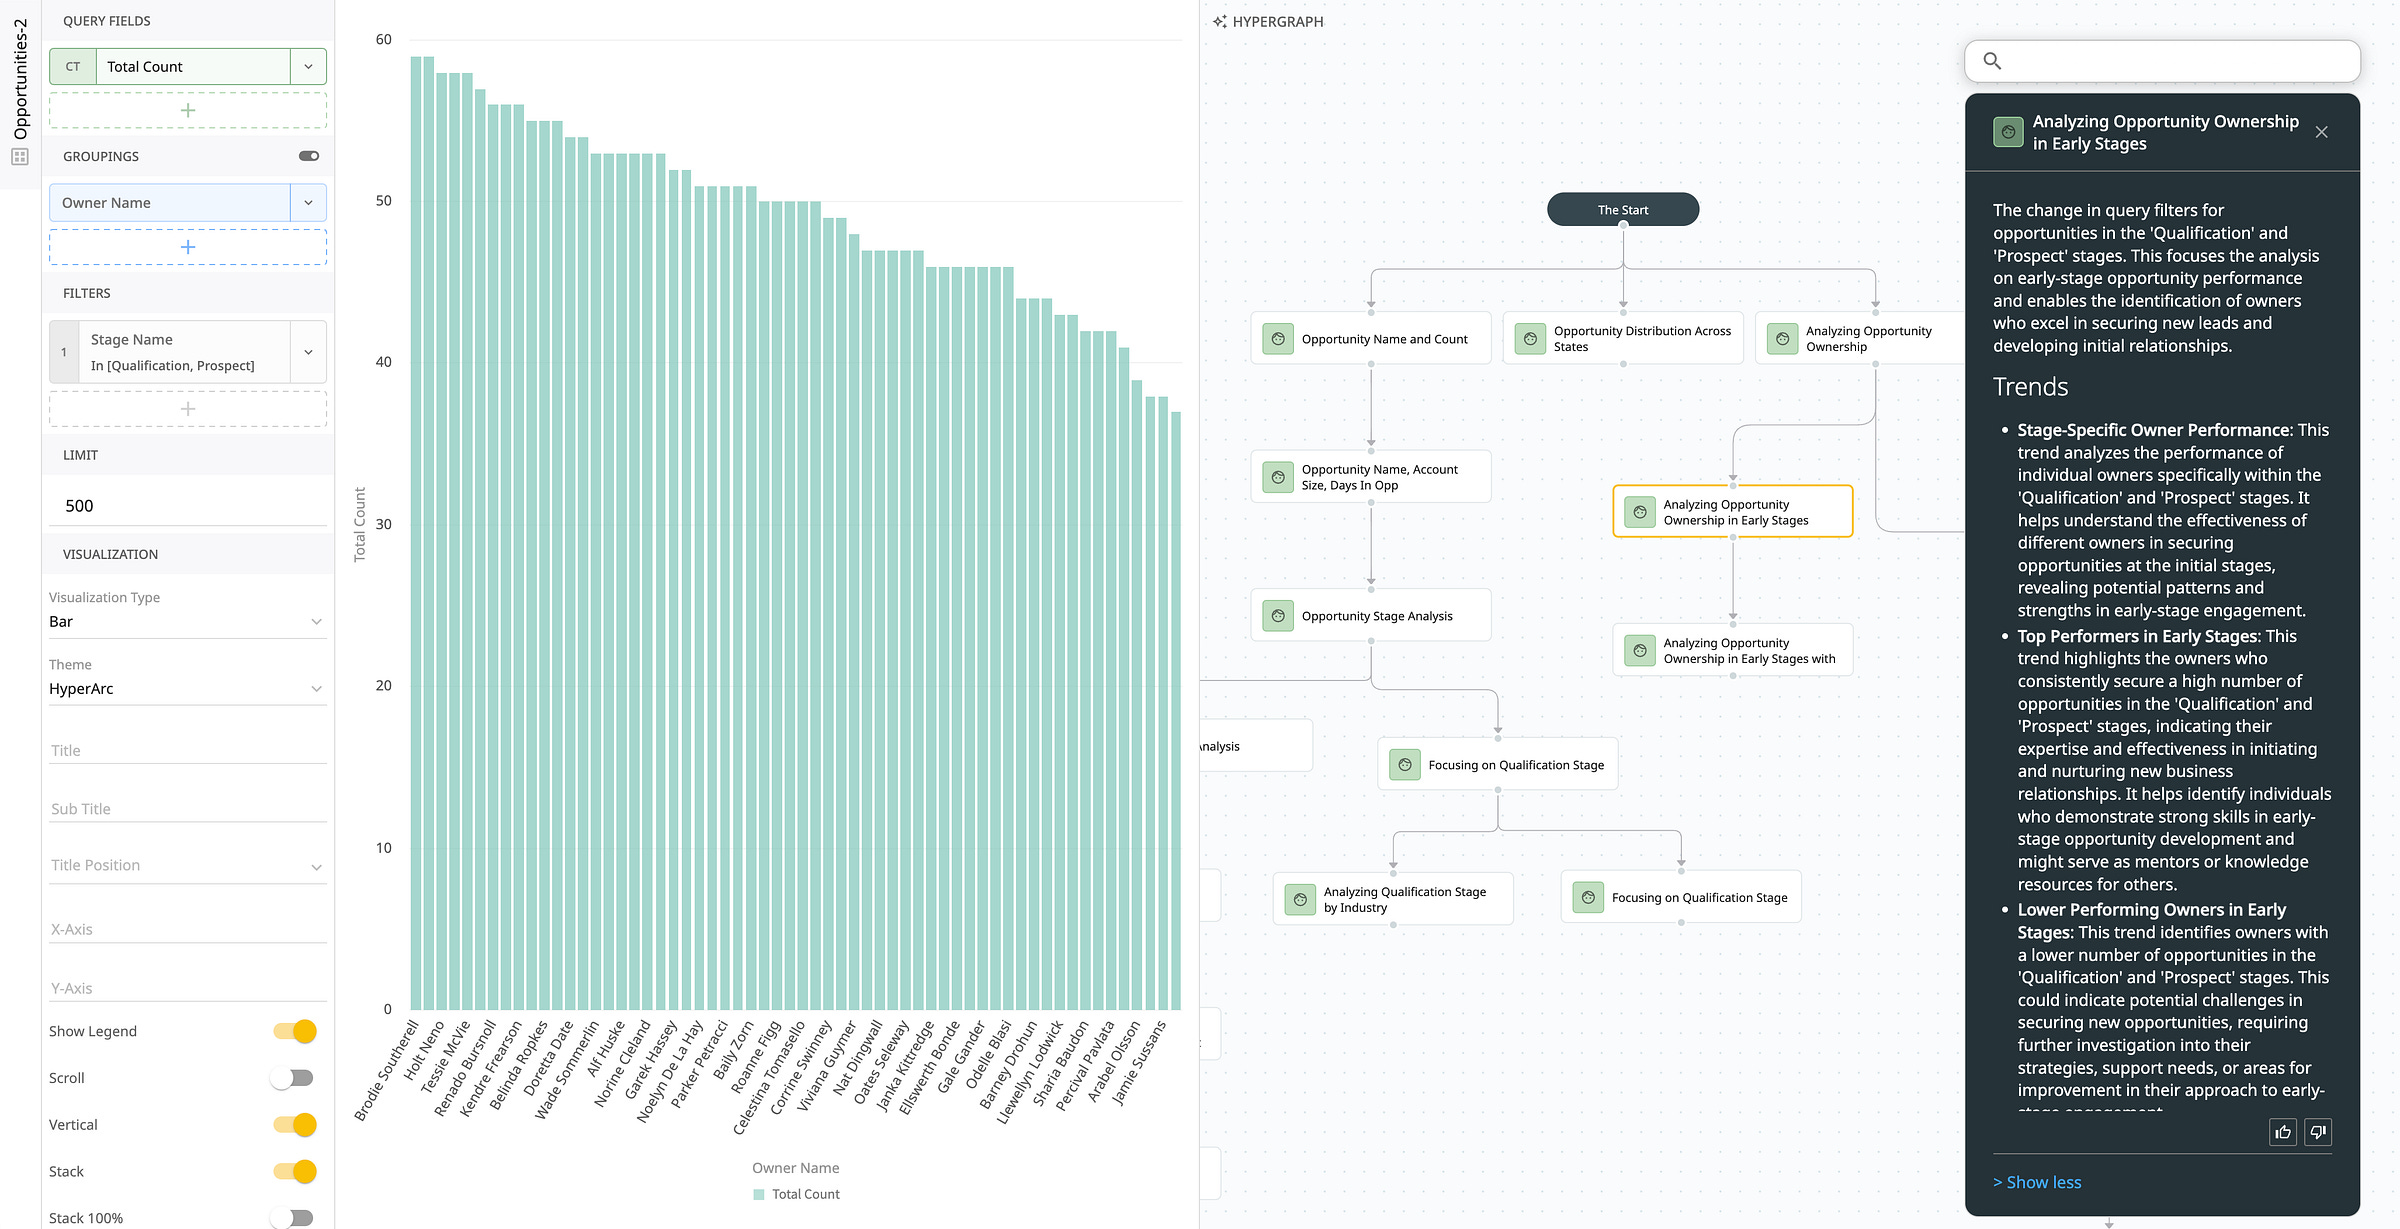
Our analysis below of Opportunity stage led to parallel branches to compare demo vs qualification. Along with what happened, we’re able to uniquely utilize the structure of the HyperGraph’s iterative queries and results from your actual data to synthesize an accurate intuition behind each step from mundane changes “[reducing] the limit from 500 to 50 to focus on the top 50 opportunities with the highest account sizes”…
… to major changes “in query filters for opportunities in the 'Qualification' and 'Prospect' stages, [focusing] the analysis on early-stage opportunity performance [that] enables the identification of owners who excel in securing new leads and developing initial relationships.”
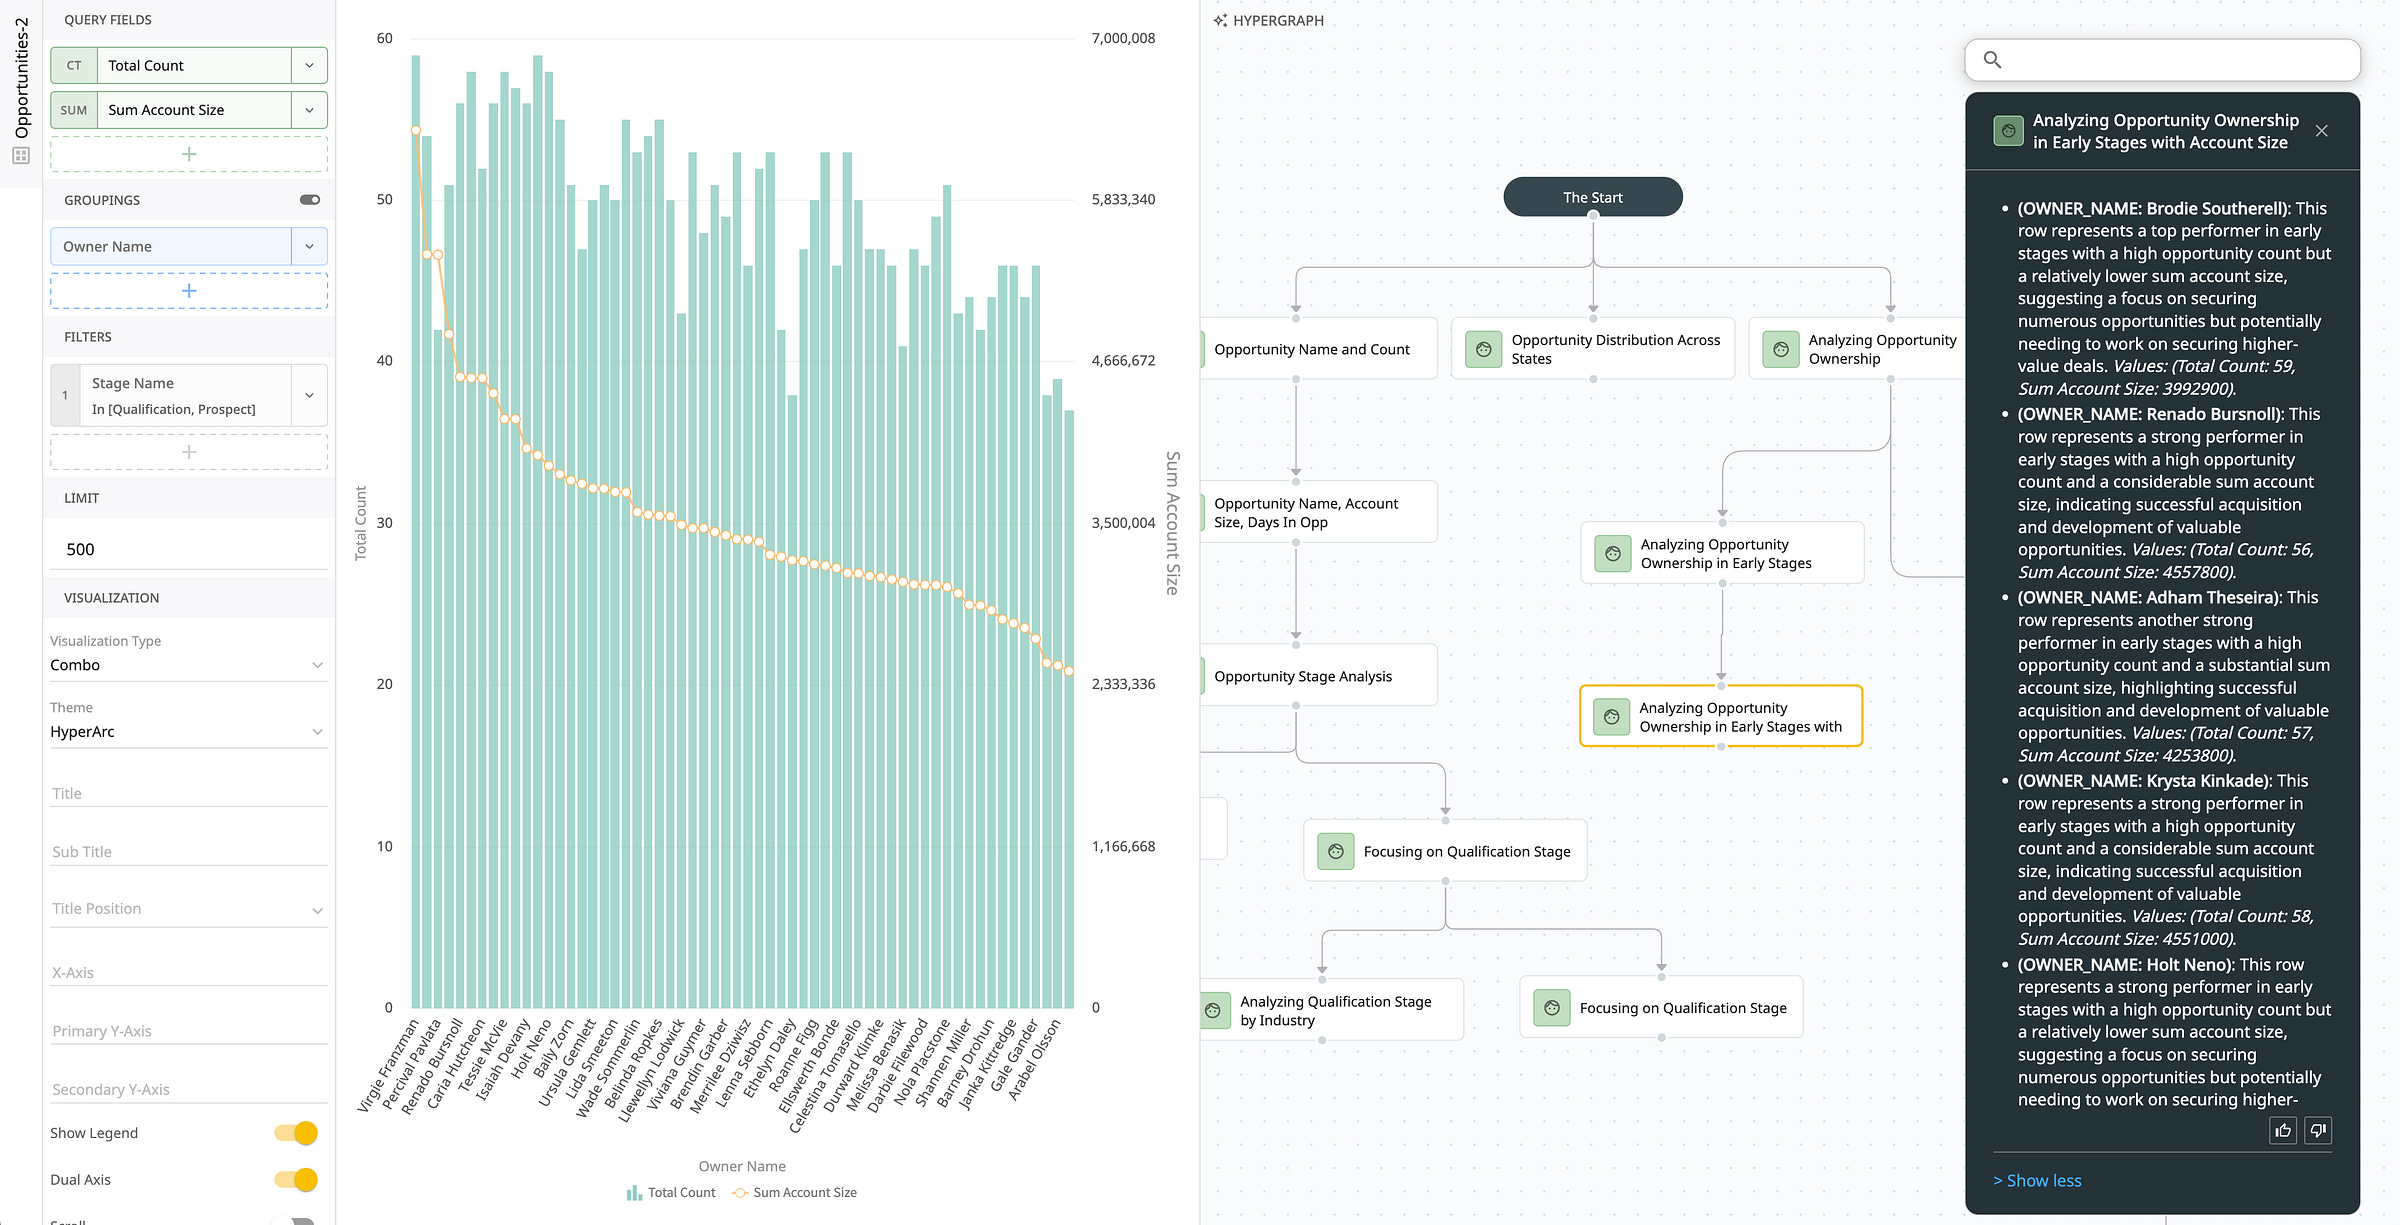
At each stage we’re able to identify important trends as well as specific data points with multi-metric analysis such as Brodie Southerell being “a top performer in early stages with a high opportunity count but a relatively lower sum account size, suggesting a focus on securing numerous opportunities but potentially needing to work on securing higher-value deals.”
LLMs are currently not the best for numerical analysis from forecasting to making sense of raw data with practical limitations around context length which is why we don’t ask it to go from 0 to 100 — from natural language question to answer — on its own. We instead ask it to be the memory and be the incremental notetaker for an analyst and their human intuition, generating 1000x the language stored in a traditional BI.
No human has time to read a novel every time they need a metric, but now we have the grounded and detailed intuition annotating your numerical data as language, what LLMs uniquely excel at and addressing their limitations around raw data.
Anti-Metrics, Cited Answers, and Assisted Discovery.
Instead of metrics after the fact, analysts can add to or replace the language with their own words or simply thumbs up or down different insights, promoting them to metrics or anti-metrics. With a simple thumbs down, we’re able to now catalog common data pitfalls along with promoted metrics.
Because of the language and the human in the loop interaction were able to provide citable answers grounded in the actual data and importantly know where the data and past analysis has actually stopped for questions like “which airports are most impacted by tsa” instead of hallucinating a probable response (trick question, all of them).
Along with metrics, anti-metrics, and citable answers were able to also use this knowledge base for things like assisted discovery, check it out in action below!
Come help!
We need your help to explore what this new knowledge artifact can do for your business and understanding of your data! We’re looking for passionate teams and analysts who want to give HyperArc a try and help shape the product with us. Book a demo or just shoot us a note at founders@hyperarc.com even if you think we’re totally wrong and metrics is all you need.


